
Inequality
Inequality is the unequal distribution of resources and opportunities among various groups in society.
Disparities in the distribution of economic assets and income are referred to as "economic inequality."
Economic inequality is the inherent discrepancy that allows one person to have certain material options while denying another those same choices. The concept of inequality is inextricably tied to ideas like lifespan, human capabilities, and political liberties.
Example: Joo and José may make the same amount of money, but Joo may be physically disabled and José is not. John is wealthier than James, but he lives in a nation that restricts him from numerous liberties, including the right to vote and travel freely.
Inequality may be observed from a variety of angles, all of which are interconnected. 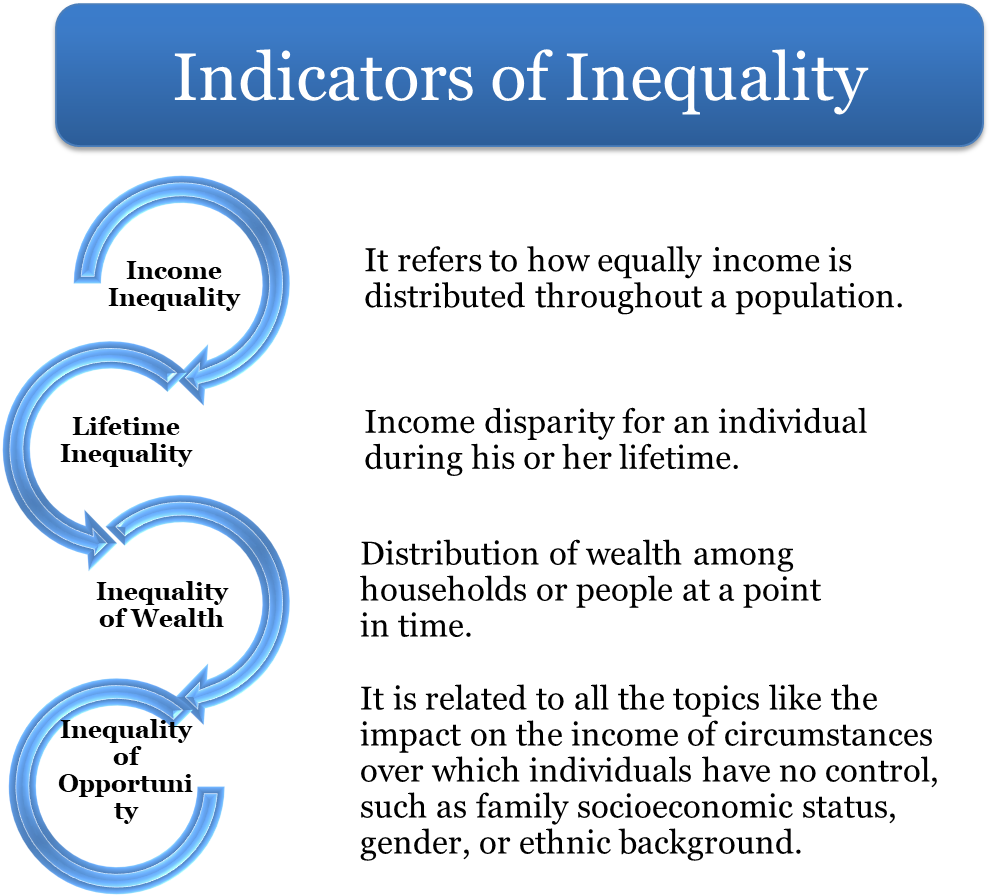
All of these inequality ideas are connected and provide various but complementary insights into the origins and effects of inequality.
Types of Inequality
- Income Inequality
- The degree to which money is divided unevenly among a group of individuals is referred to as income inequality.
- Income includes all money obtained through employment (wages, salaries, bonuses, and so on), investments (such as income on savings accounts and dividends on stock shares), savings, state benefits, pensions (state, personal, and business), and rent.
- Gross income is defined as household income before taxes that includes money received from the social security system. Net income is the total of all taxes and benefits paid by a household.
- Pay Inequality
- A person's wage is distinct from their income.
- Pay simply relates to remuneration from employment. This might be on an hourly, monthly, or annual basis, is usually paid weekly or monthly and may include bonuses. The disparity in salary between individuals is therefore described by pay inequality.
- Wealth Inequality
- The total value of an individual's or household's assets is referred to as wealth. These might include financial assets like bonds and equities, as well as real estate and private pension rights.
- Hence, wealth inequality refers to the unequal distribution of assets among a group of individuals.
These three are the main sources of economic inequality.
- Regional Inequality
- It refers to people's quality of life, wealth, and living standards fluctuating depending on where they live and/or work. The focus is on disparities in human welfare or well-being and associated characteristics of regional life.
Measures of Economic Inequality
- Lorenz Curve
- The Lorenz curve depicts the distribution of income (or wealth) within an economy. In other words, it depicts the cumulative proportion of income from various segments of the population.
- Max O. Lorenz created it in 1905 to depict wealth distribution.
- The Lorenz curve begins and ends on a 45° line: the poorest 0% earn 0% of national income by definition, whereas the poorest 100% is the whole population and must earn 100% of income.
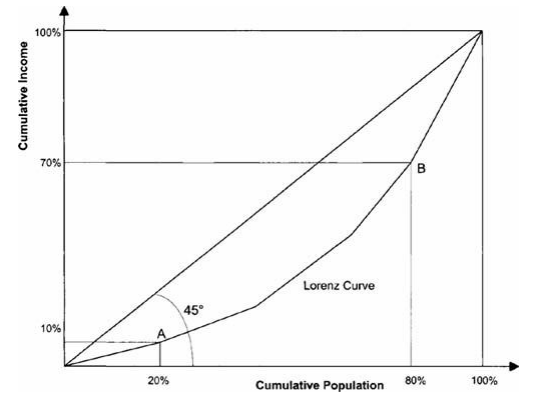
- The 45° line shows the equal distribution of income.
- When inequality increases, the Lorenz curve begins to dip below the diagonal in a loop that is always bowed out to the right of the picture; it cannot curve in the other direction.
- The "total distance" between the 45° line and the Lorenz curve shows the level of inequality in the society it depicts. The Lorenz curve will deviate from the 45° line as the degree of inequality increases.
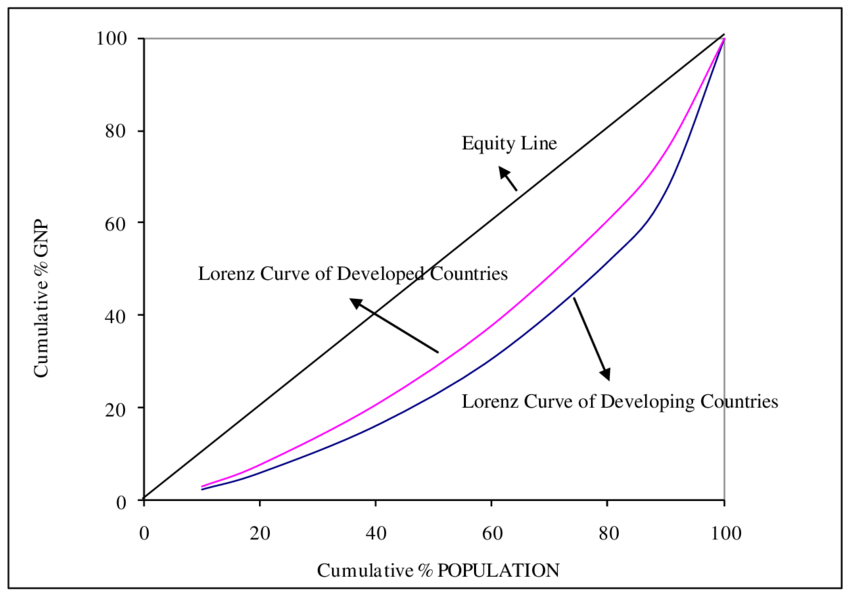
- The Lorenz curve of the developed countries will be closer to the 45° line and the Lorenz curve of the developing countries will be further.
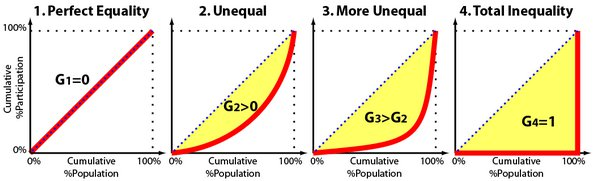
- Gini Coefficient
- The Gini coefficient is a statistical measure of inequality that reflects how equally or unequally distributed income or wealth is among a country's population.
- Corrado Gini, an Italian statistician, invented it in 1912.
- The coefficient runs from 0 (or 0%) to 1 (or 100%)
- 0 indicating perfect equality
- 1 indicating complete inequality
- Values greater than one are theoretically possible owing to a lack of income or riches.
- The Gini coefficient is precisely the ratio of the area of the triangle below the 45° line to the area of the Lorenz curve.
- The Lorenz Curve may be used to compute the Gini coefficient, which is another measure of inequality.
- Kuznets Ratio
-
- Simon Kuznets pioneered the use of these ratios in his research of income disparities in industrialized and emerging nations.
- These ratios relate to the percentage of income possessed by the ratio of the richest x% to the poorest y%, where x and y represent integers such as 10, 20, or 40. For example, the lowest 20 or 40% of the population, or the richest 10%.
- The ratios are effective "parts" of the Lorenz curve and, like the range, serve as a handy shorthand.
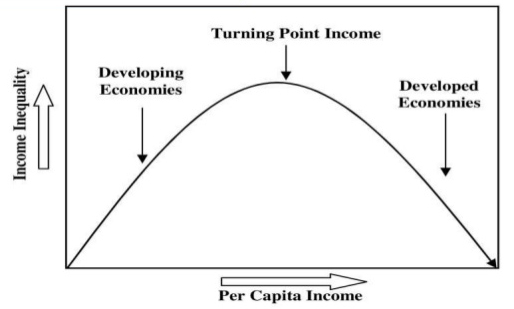
- The Kuznets Curve is used to show the concept that economic expansion first increases inequality, followed by a decrease in disparity.
- The curve is inverted U-shaped.
- Because economic growth is generated by the development of better products, it typically raises the income of employees and investors who participate in the first wave of innovation.
- Hoover Index
- Hoover index is a measure of inequality in income.
- It is also known as the Ricci-Schutz coefficient or the Pietra index or the Robin Hood index.
- It is the simple measure of income inequality which shows the proportion of all income that would have to be redistributed in order to achieve equality.
- Hoover index ranges from 0 to 1 where 0 indicates perfect equality ie., egalitarian distribution and 1 indicates perfect inequality ie., more redistribution is needed to achieve income equality.

- The Hoover index can be graphically represented as the maximum vertical distance between the 45° line and the Lorenz curve.
- The Atkinson Score
- Anthony Barnes Atkinson, a British economist, developed it.
- The metric is useful for establishing which end of the distribution is mainly responsible for the observed inequality.
- The Atkinson index, like the Gini coefficient, ranges from 0 to 1
- 0 indicating perfect equality
- 1 representing the perfect disparity
- An Atkinson index of x% indicates that individuals are prepared to give up x% of their existing income to equalize the distribution.
- In other words, "If society could advance towards an equal distribution of wealth, what proportion of income would it be willing to give up to do so?" asks the Atkinson index. The Atkinson index is represented by this fraction.
- Palma Ratio
- The Palma index is calculated by adding the income received by households in the top decile (the top 10%) to the income earned by the 40% of most disadvantaged households.
- This indicator is based on the idea that economic processes at the extreme ends of the resource distribution are mostly responsible for inequality (earned income, accumulated savings).
- Unlike, the Gini coefficient, the index does not include the middle class in its calculations.
- The ratio thus measures inequality between the extremes of the distribution at the top and bottom.
Causes of inequality
- Unemployment
- The fundamental cause of the majority of poor income is unemployment and underemployment, as well as the resulting low labor productivity. Poor labor productivity means a low pace of economic growth, which is the primary source of poverty and inequality among big populations.
- In reality, inequality, poverty, and unemployment are all linked. Because adequate employment could not be produced through the process of planned economic growth, most people's income levels could not be raised.
- Inflation
- Inflation is another source of inequality. During an inflationary period, few profit earners benefit while the majority of wage earners suffer. This is precisely what has occurred in developing countries. Profits have soared while salaries have lagged behind prices. This has resulted in increasing inequality. Moreover, while money income rises during inflation, real income declines. As a result, the poor's standard of living diminishes since their purchasing power falls.
- Workers in the organized sector receive greater earnings during inflation, which helps to offset the effect of price increases. Nonetheless, earnings and salaries in unorganized sectors (such as agriculture and small-scale and cottage enterprises) remain stagnant. As a result, their actual income (buying income) diminishes.
- This is how income distribution disparity grows between the two major segments of the economy - organized and unorganized.
- Tax evasion
- Personal income tax rates in India are quite high. Tax evasion and avoidance are encouraged by high tax rates, leading to the formation of a parallel economy.
- This is precisely what occurred in India throughout the plan period. The unofficial economy is as powerful as (if not stronger than) the formal economy in this country.
- Income and wealth distribution imbalances are caused by high tax rates. This is because of a disproportionate concentration of revenue in a few hands as a result of rampant tax evasion.
- Regressive Tax
- Indirect taxes provide the most money for the government. Yet, they are regressive in character. Due to the government's increasing reliance on such taxes, such levies have also increased inequality over time.
- New Agrarian Strategy
- India's new agricultural approach was responsible for the Green Revolution and increased agricultural production. Yet, the benefits of increased production were mostly enjoyed by wealthy farmers and landowners.
- Meanwhile, the economic situations of landless laborers and marginal farmers have deteriorated over time. Most farmers in India are unable to reap the benefits of increased agricultural productivity. As a result, income distribution disparity in rural regions has worsened.
- Education
- The varying capacity of individuals to obtain an education is a key aspect in the establishment of inequality.
- Education, particularly education in a field with a strong demand for employees, results in high earnings for people with this degree.
- Those who cannot afford an education, on the other hand, often earn a substantially lower income.
- It is believed that a rise in the need for highly trained personnel in high-tech companies is a key explanation for the world's growing levels of inequality since the 1980s.
- Gender, Race, and Culture
- Economic disparity is assumed to be exacerbated by the presence of multiple genders, ethnicities, and cultures within a community.
- It is believed that in many nations, people of specific racial and ethnic minorities are more likely to be impoverished than others. Cultural disparities between races, an educational success gap, and racism are among the postulated explanations of this disparity in those countries where this can be demonstrated.
Consequences of Inequality
- Social conflict among social groups is frequently caused by inequalities.
- For example, caste groups such as Jaats, Maratha, and Patels are demanding reservations, but this demand is opposed by caste groups who already benefit from reservations; such a clash of interests due to perceived inequality tends to produce violent conflicts between opposing caste groups.
- Inequality among ethnic groups has sparked a slew of ethnic movements calling for independent states, autonomous regions, or even outright independence from India.
- Religious disparity creates a sense of marginalization among religious minority groups.
- This diminishes their engagement in mainstream society.
- For example, Because religious minorities have a big population in India, their economic exclusion jeopardizes the nation's GDP development as a whole.
- Low development indices such as IMR and MMR, low per capita income, poor education and learning results in schools, and a high rate of population increase can all be attributed to existing socioeconomic disparities.
- Excessive levels of economic disparity are harmful to public healthcare and education. Higher and middle-class people have no vested interest in well-functioning public healthcare and education since they can afford private healthcare and education.
Ways to reduce inequality
- Skill Development
- India is to capitalize on its demographic dividend, it must first develop sophisticated skills among its youth. The only way to eliminate inequality is to increase educational investment in the young. India must transition to a skill-led economy.
- Taxation
- Raising taxes on the wealthy and on luxury would assist to lessen income disparities.
- These taxes should go towards funding public programs that lessen inequality.
- Tax breaks for companies that give their workers a larger portion of their profits may also help to balance the scales.
- Equal Opportunity for All
- The government may invent and establish some form of machinery to offer equal opportunity to all affluent and poor people in finding work or starting a business.
- In other words, something could be done to reduce the effect of family members on career choices.
- For example, the government may establish a system of generous stipends and scholarships to enable even the poorest citizens to get the highest level of education and technical expertise.
- The historically oppressed segments of society require a forum to speak, deliberate, and coordinate in order to attain their goals.
- Women's empowerment should be promoted, and there should be discussions about equal pay for men and women, aiding girls' education, ensuring that no one is discriminated against because of their gender, and so on.
- Promote Labor-Intensive Manufacturing
- The failure to encourage labor-intensive products such as construction, textile, clothing, and footwear is the single most significant cause of growing disparities. Manufacturing, which is labor-intensive, has the ability to absorb millions of individuals who are abandoning farming.
- Agriculture's share of the labor force has decreased, but the employees who have left farms have not found work in contemporary manufacturing or offices. Most are trapped in small, unorganized businesses with little production. Inequality may be reduced if India could reverse this tendency and boost the labor-intensive industry.
- Inclusive Growth
- The promotion and implementation of an Inclusive Growth Agenda is the only way to address the challenge of growing inequality. Inequality will be exacerbated if economic development is not inclusive.
- Investment
- Investing in human development indicators such as healthcare, education, and social safety in order to minimize inequality.
- For example, if a government invests in free and high-quality public services, impoverished people will be able to save money.
- The government should invest more in R&D and innovation.