News Excerpt:
Contrary to national trends, consumption inequality increased in rural areas of 11 states as the Gini coefficient of total consumption spending increased between 2011-12 and 2022-23, according to a newly released Household Consumption spending Survey (HCES).
|
Gini coefficient:
|
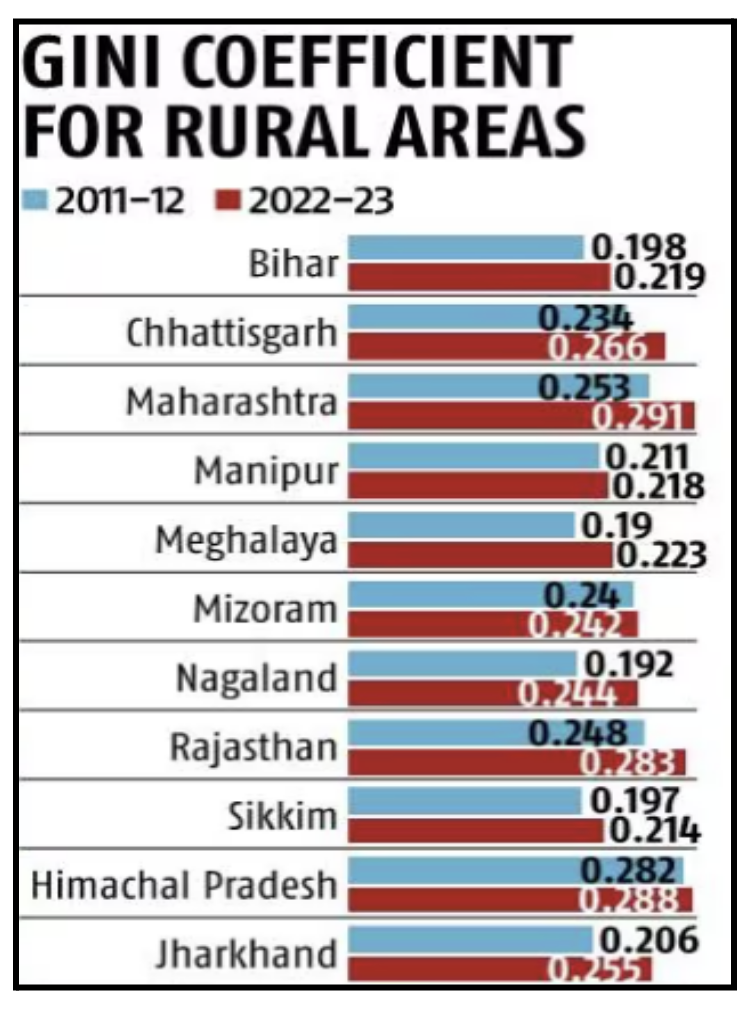
- The rise in Gini coefficient was the sharpest in Nagaland (0.244 from 0.192), followed by Jharkhand (0.255 from 0.206), Maharashtra (0.291 from 0.253), Rajasthan (0.283 from 0.248), Meghalaya (0.223 from 0.19) and Chhattisgarh (0.266 from 0.234).
More about News
-
Out of the 25 states included in the analysis, Bihar, Chhattisgarh, Jharkhand, Maharashtra, Manipur, Meghalaya, Mizoram, Nagaland, Sikkim, Himachal Pradesh, and Rajasthan have observed increases in the Gini coefficient in rural areas.
- Additionally, the data reveals that in three states, the Gini coefficient for consumption expenditure has increased in urban regions as well. These are Meghalaya (0.266 from 0.226), Himachal Pradesh (0.311 from 0.29) and Manipur (0.221 from 0.209).
National Trend of inequality
- This rise in Gini coefficient in rural areas comes on the back of a general decline seen in the coefficient of total consumption expenditure over this time period at the national level.
- At the all-India level, the Gini coefficient has gone down to 0.266 in 2022-23 from 0.283 in 2011-12 (rural areas).
- For urban areas, it has gone down to 0.314 from 0.363 during the same period. This fall in Gini coefficient shows a decline in spending inequality in the country.
Rationale behind this Paradox
- According to the Chairperson of the Standing Committee on Statistics, the current HCES dataset, which shows a drop in national consumption inequality, is an exception. This is due to the fact that the rise in income disparity in India over the last three decades has been a generally acknowledged and verified phenomena.
- Because affluent households do not disclose their spending accurately, the likelihood of data errors has increased.
Read more about Household Consumption spending Survey
|
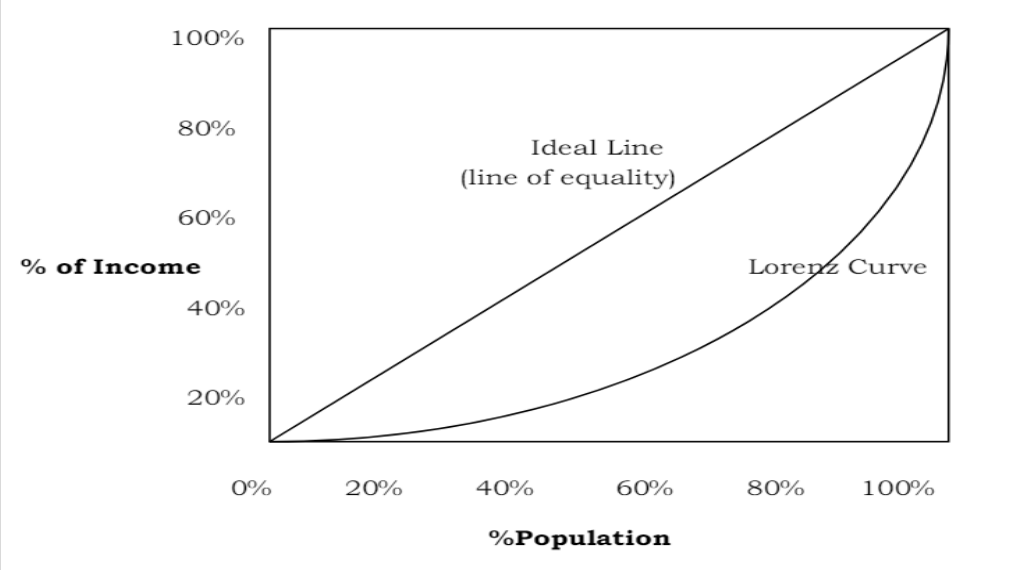
Measurement of Income inequalities Lorenz Curve
|